Boards
A board with several panels open side by side — documents, a chart, and a molecule.
1. What a Board Is
1.1 Opening and Managing Boards
- Open Board starts a fresh, blank board.
- My Boards drops down the boards saved in this project. Each one is tagged me if you created it or agent if a task produced it.
- Hover any board in the list to rename or delete it (renaming warns you if the name is already taken).
To add content, drag a file from the sidebar onto the board, or pin a task output to it. If you try to close or switch away from a board with unsaved changes, SciClaw checks with you first so nothing is lost.
Dragging a file from the sidebar onto a board to add a panel.
2. What You Can Preview
Whether on a board or in the preview panel on the right, SciClaw can render most of the file types you'll work with:
- Documents — PDF, Word (.docx), PowerPoint (.pptx), Excel (.xlsx / .xls / .xlsm)
- Images — .png, .jpg, .gif, .svg, .webp, .bmp, .ico, .avif
- Markdown & notes — .md / .mdx (notes are editable in place)
- Data & charts — .csv tables, Mermaid diagrams (.mmd), Jupyter notebooks (.ipynb)
- Web & code — .html, plus source and plain-text files such as .py, .js, .ts, .sh, .css, .txt, .log
- Molecular structures — opened in the interactive 3D viewer (see below)
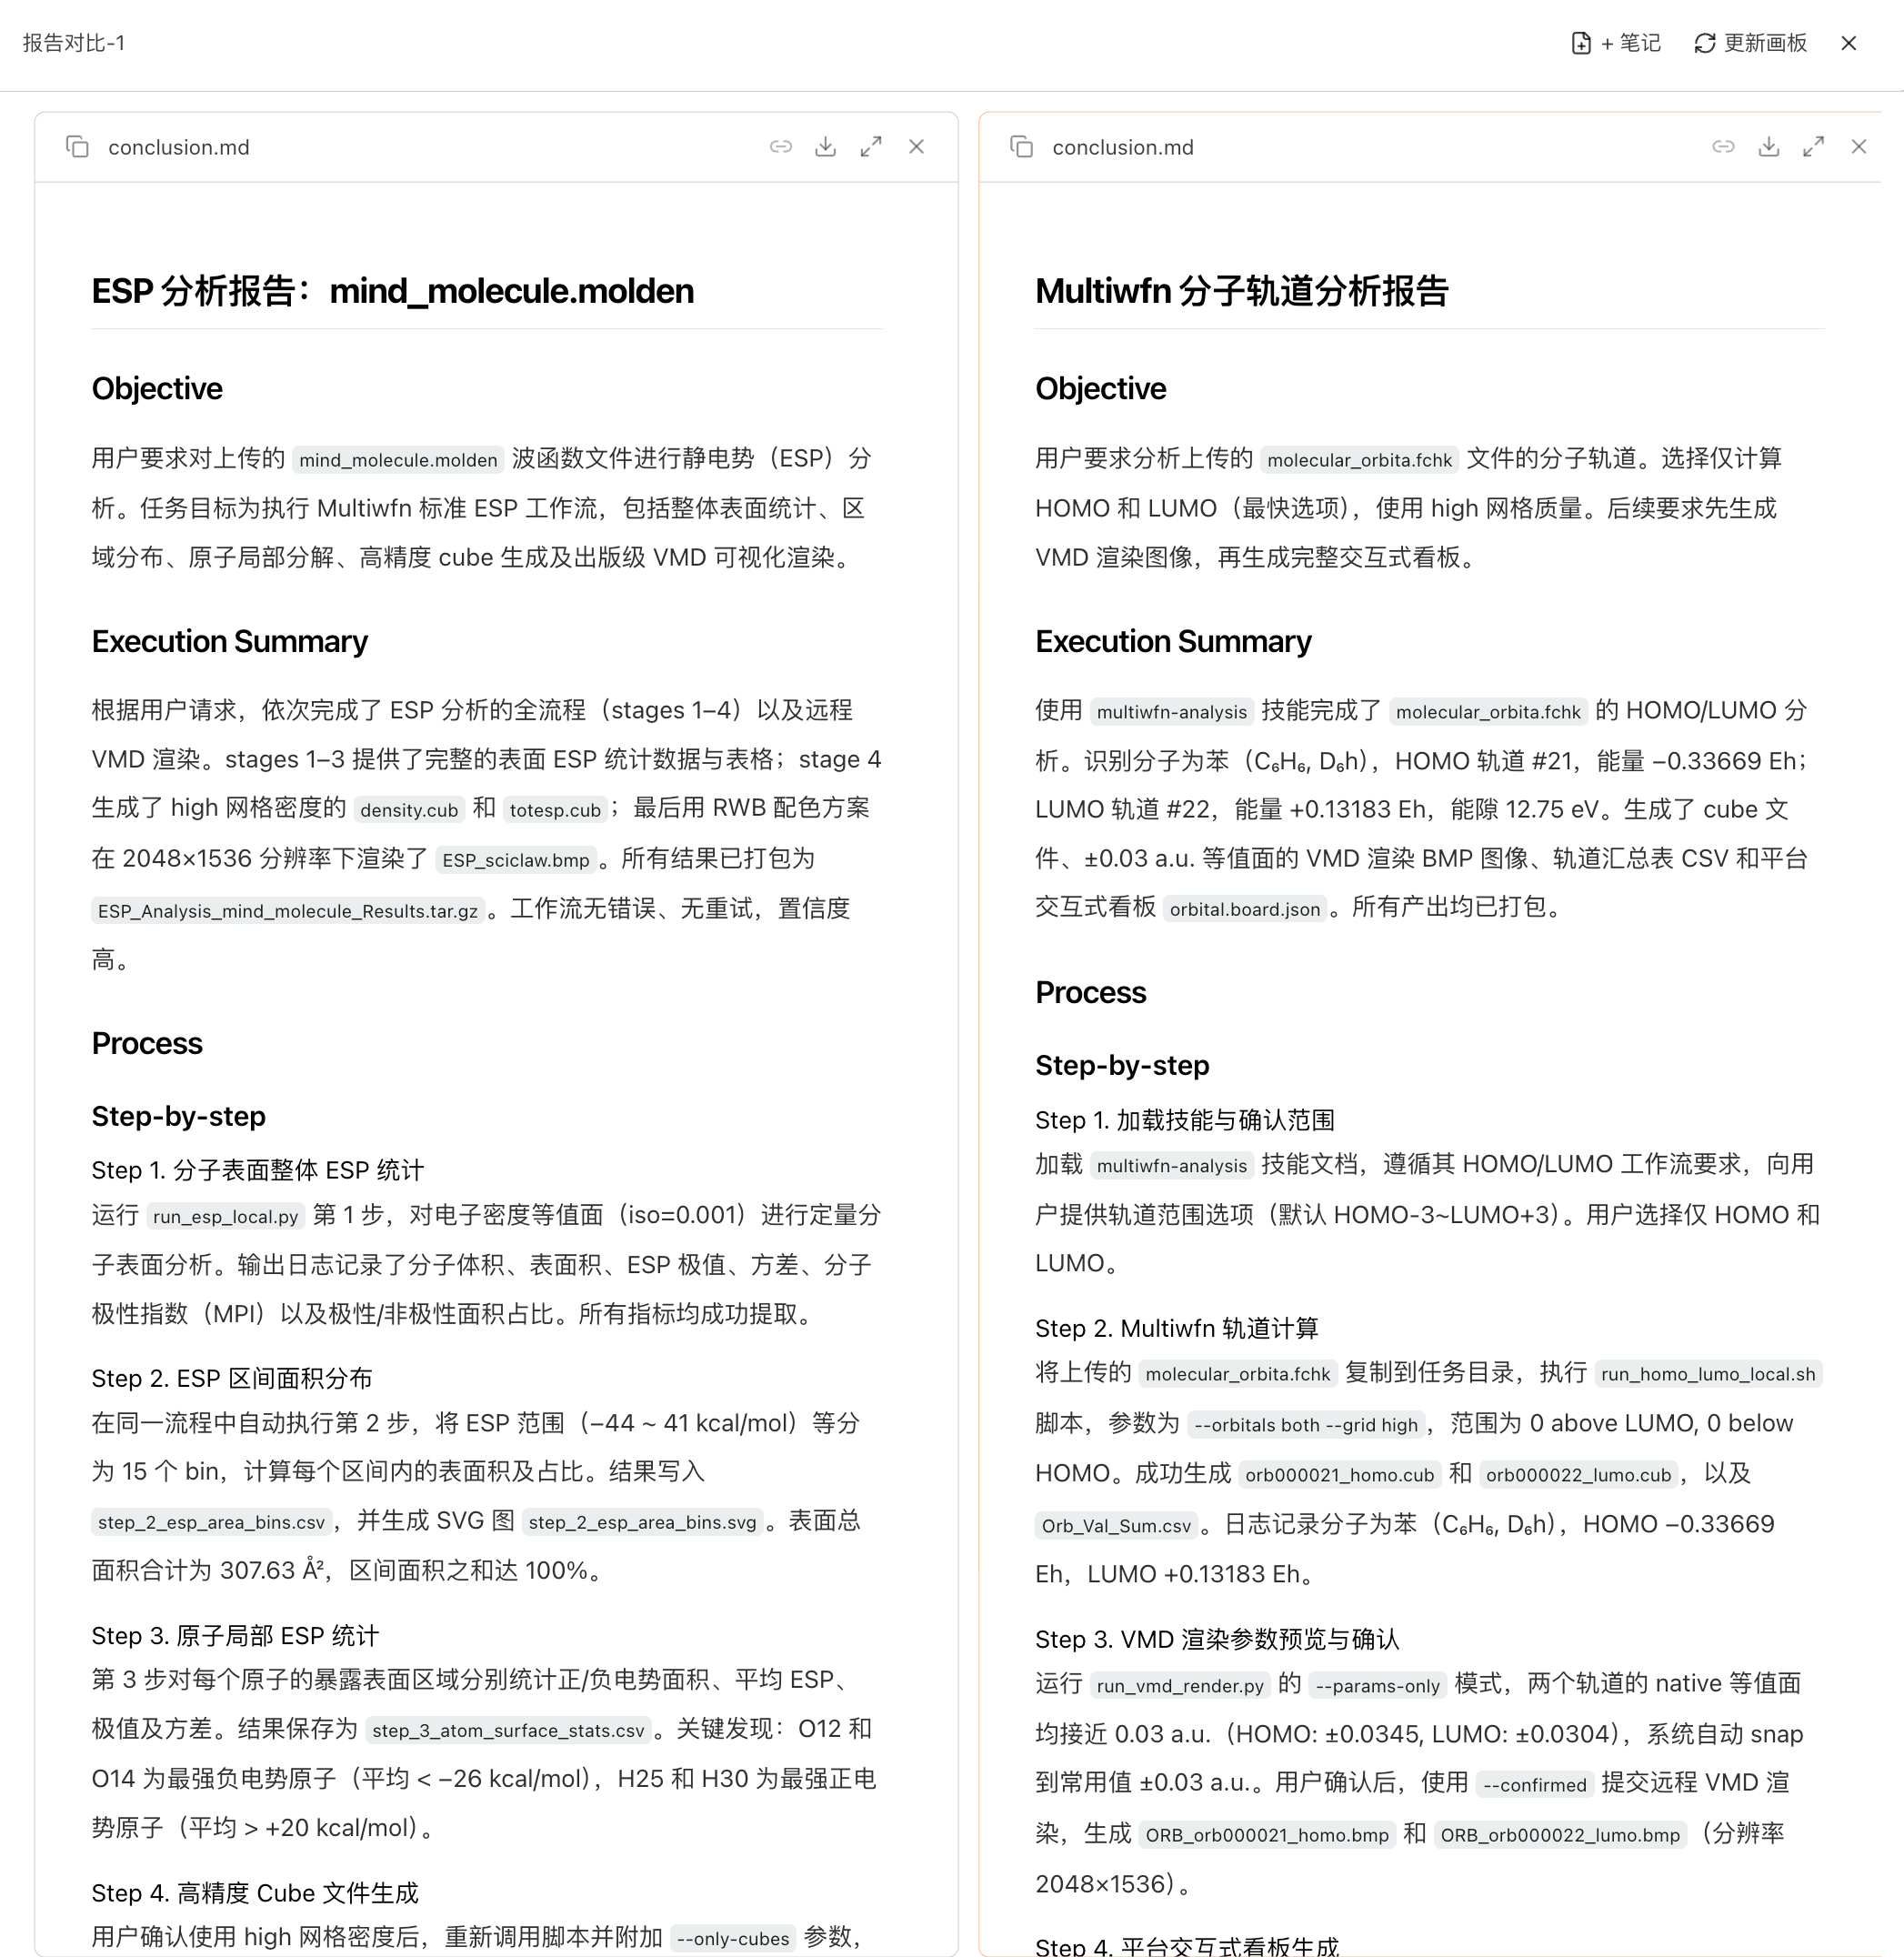
Document and spreadsheet previews shown on a board.
3. Visualizing Molecule Files
3.1 Supported Formats
- Experimental structures — .pdb, .cif / .mmcif, .mol, .mol2, .sdf, .gro, .pdbqt
- Trajectories — .xtc, .trr, .dcd, .nc
- Computational chemistry / periodic — .xyz, .cube, and VASP files (POSCAR / CONTCAR / CHGCAR)
3.2 Viewer Controls
A control rail along the viewer gives you:
- Molecule list — manage the structures loaded into the scene
- Representations — switch display styles, apply presets, and fine-tune each one; for volume / density data you can show iso-surfaces colored by value or ESP, with a draggable color-scale legend
- Scene — background color, orientation axes, auto-rotate, and a perspective / orthographic camera
- Cell / Crystal — unit-cell display for periodic structures
- Trajectory — play / pause and step through frames (first / previous / next / last)
- Vibration — animate vibrational modes
- Screenshot — export an image of the current view
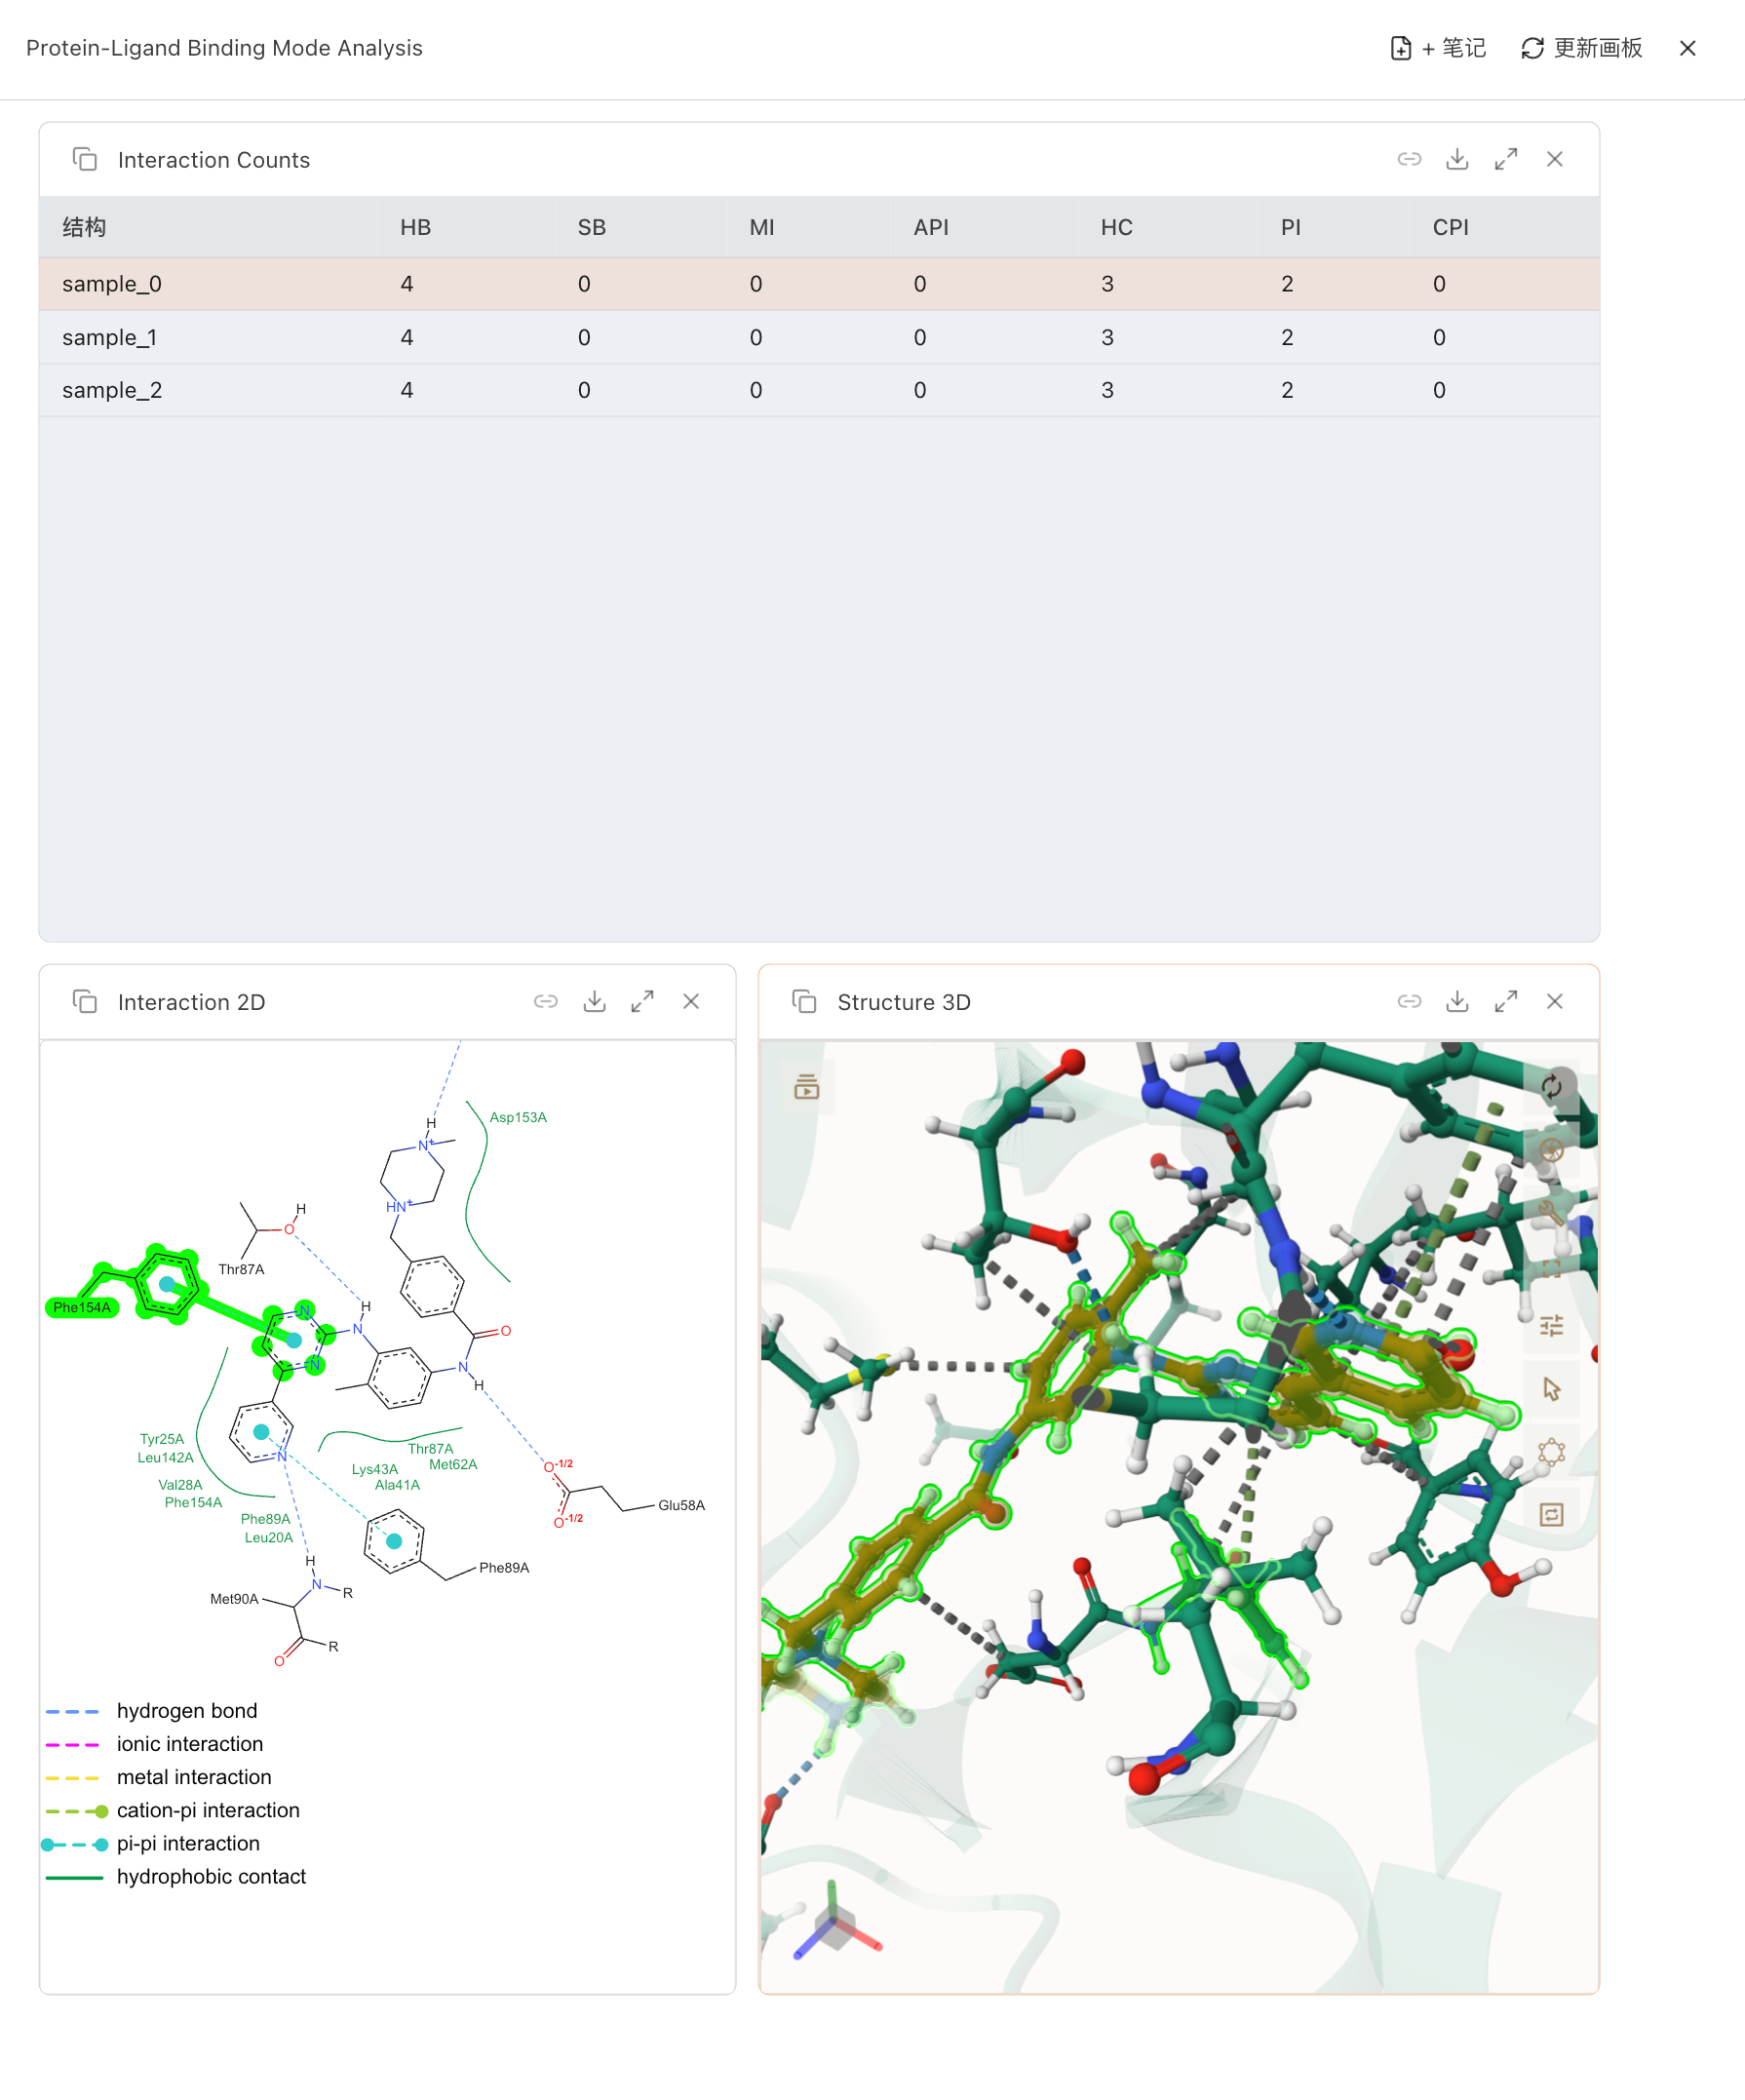
You can also select atoms to build representations around them. Experimental structures (PDB / mmCIF, opened in the Mol* viewer) additionally support interaction analysis such as protein–ligand contacts.
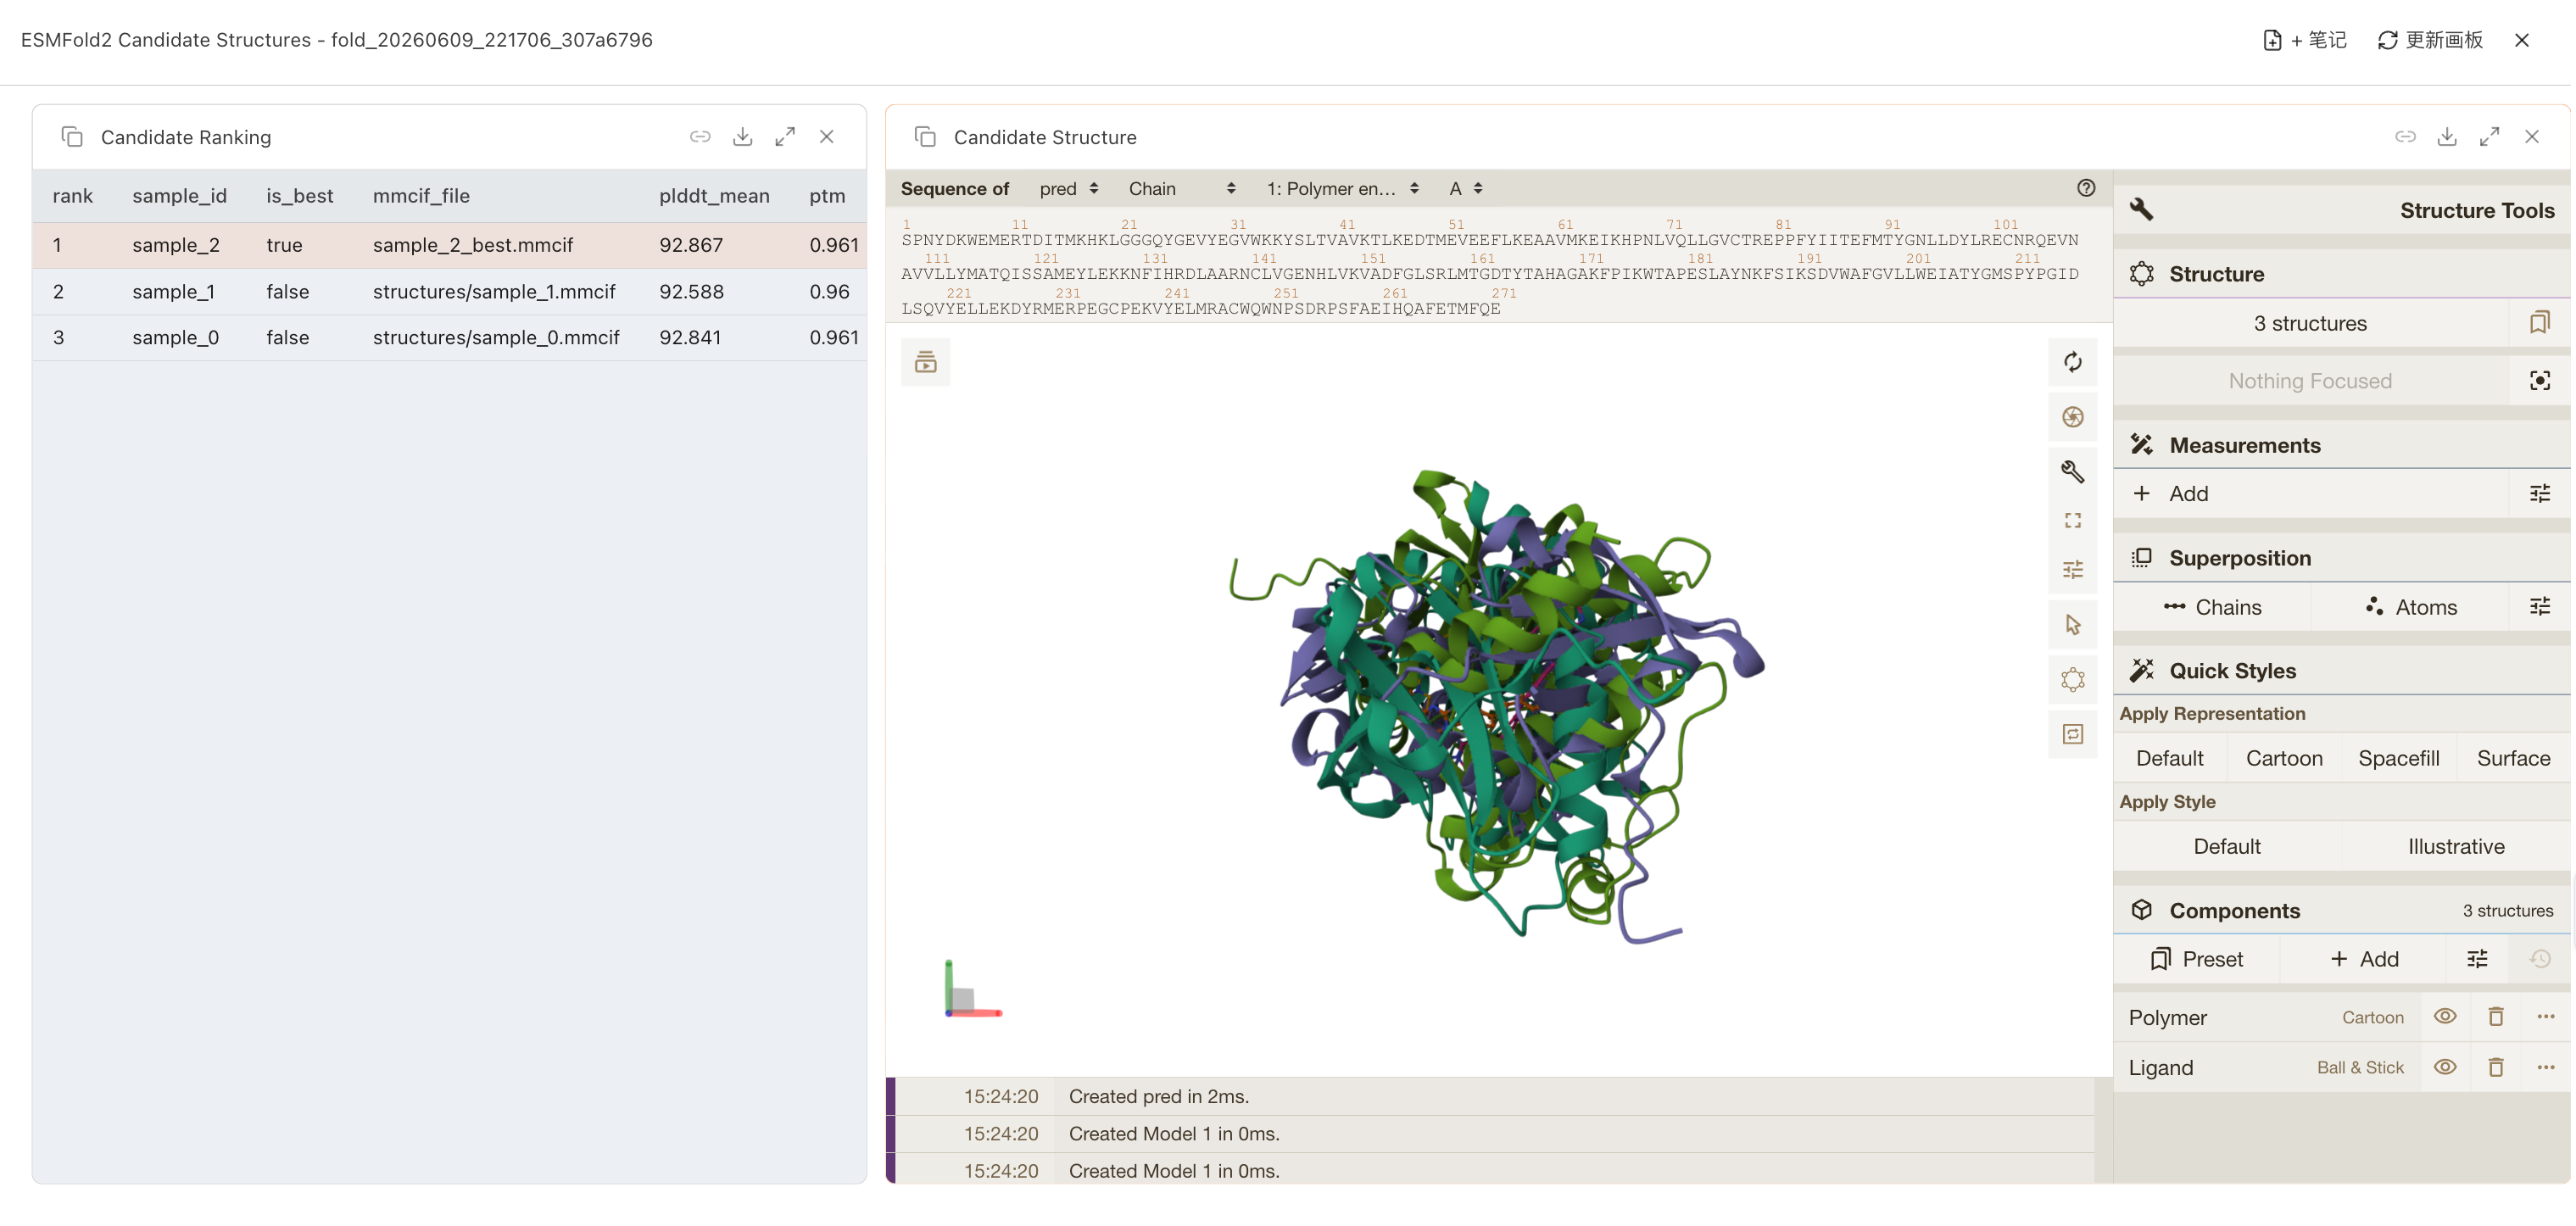
Molecule viewer: a 3D structure with the control rail — molecule list, representations, scene, trajectory, vibration, and screenshot.
Representations panel: previewing an ESP-colored iso-surface with a color-scale legend.